Mimic Diagram Editor

Mimic Diagram Editor
A canvas-based diagram editor and live monitoring platform for solar and wind energy systems — turning static single-line diagrams into interactive, configurable mimic displays with real-time data.
Project Overview
// section.overview
A configurable canvas for live solar & wind system monitoring
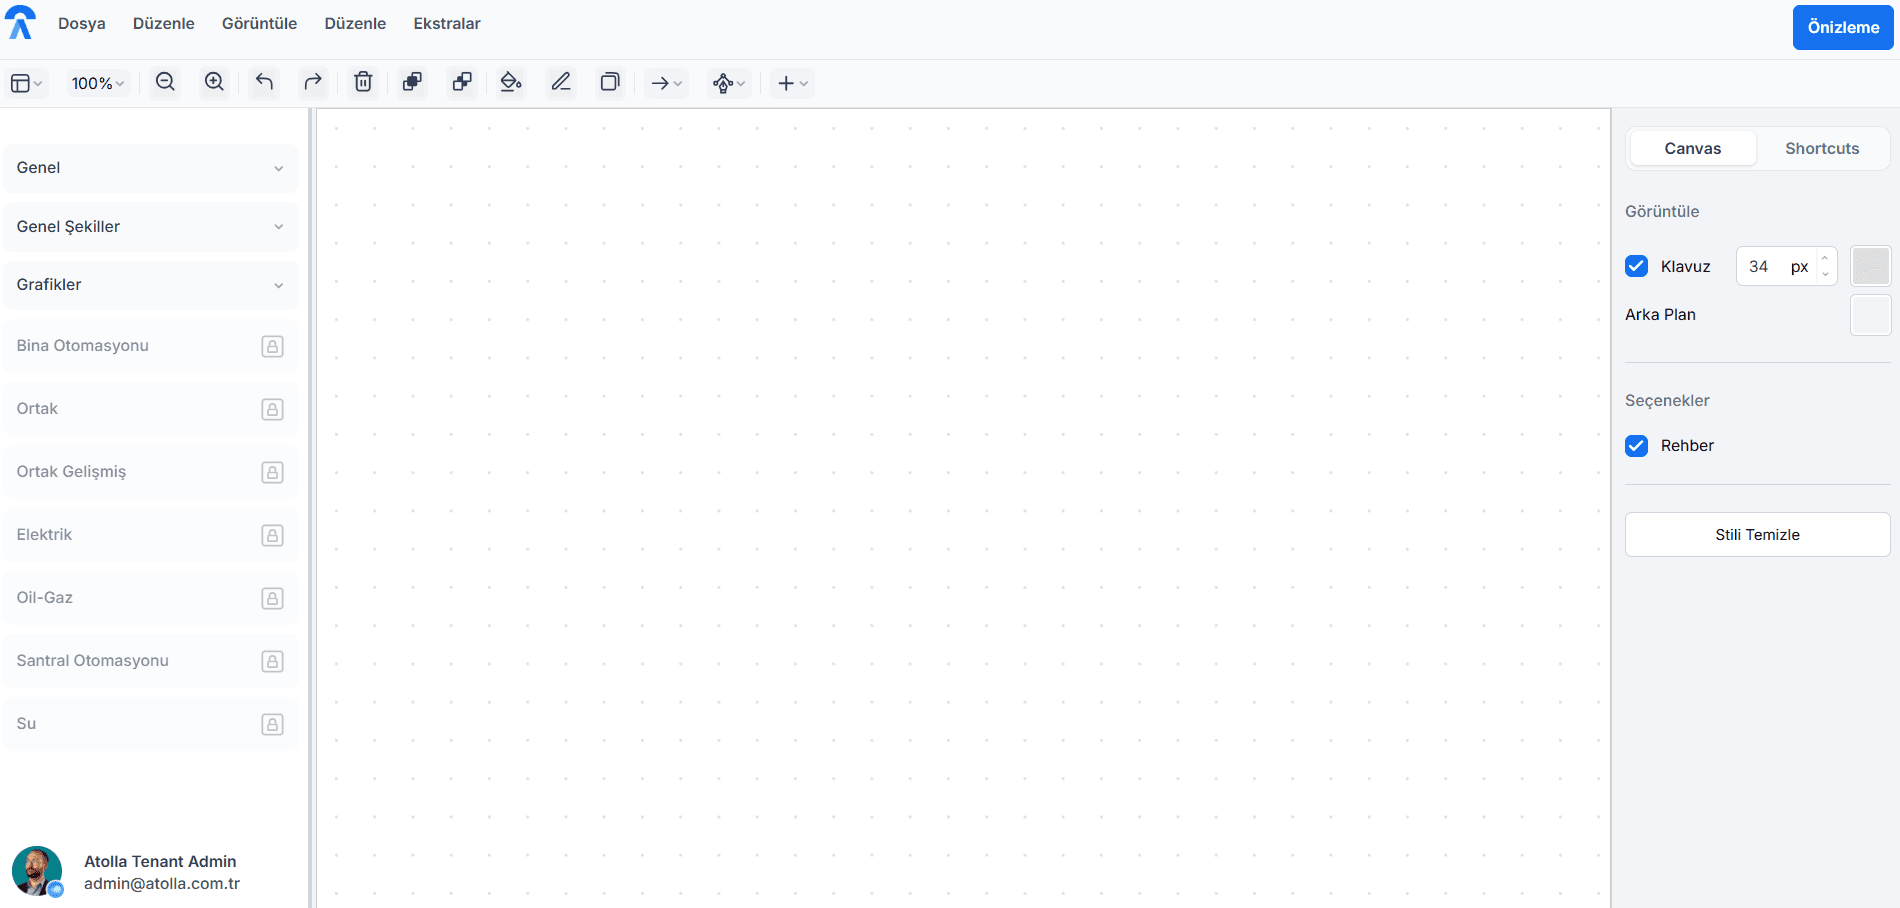
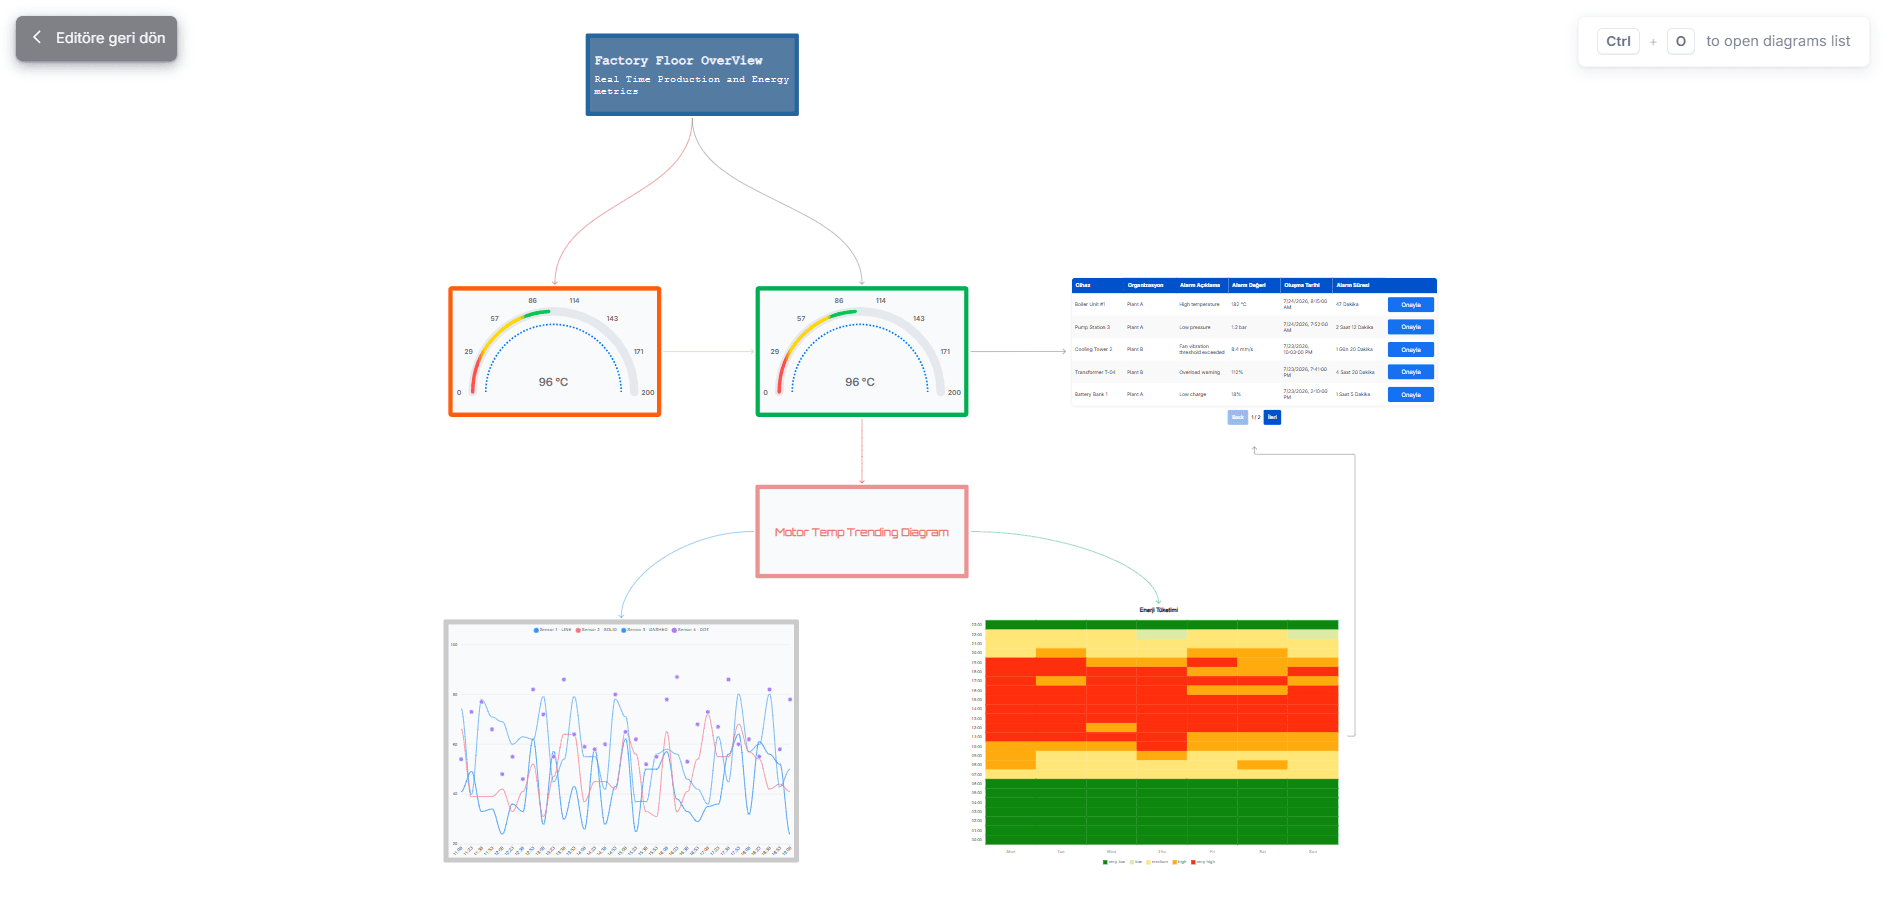
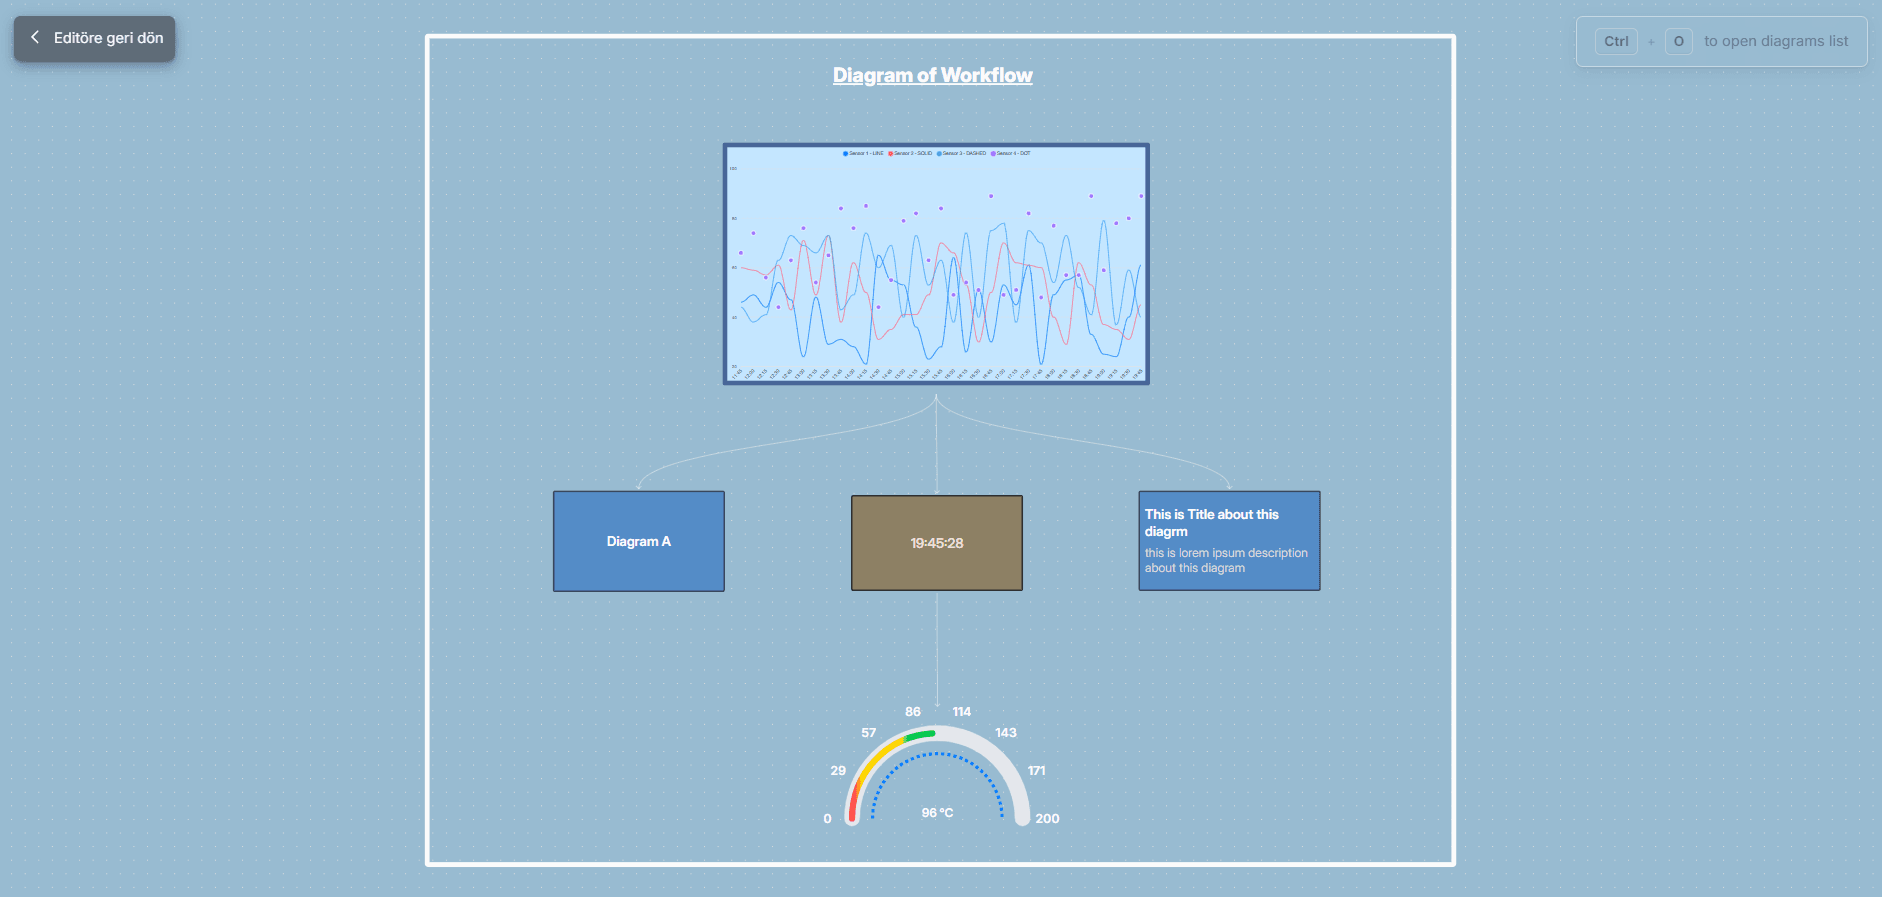
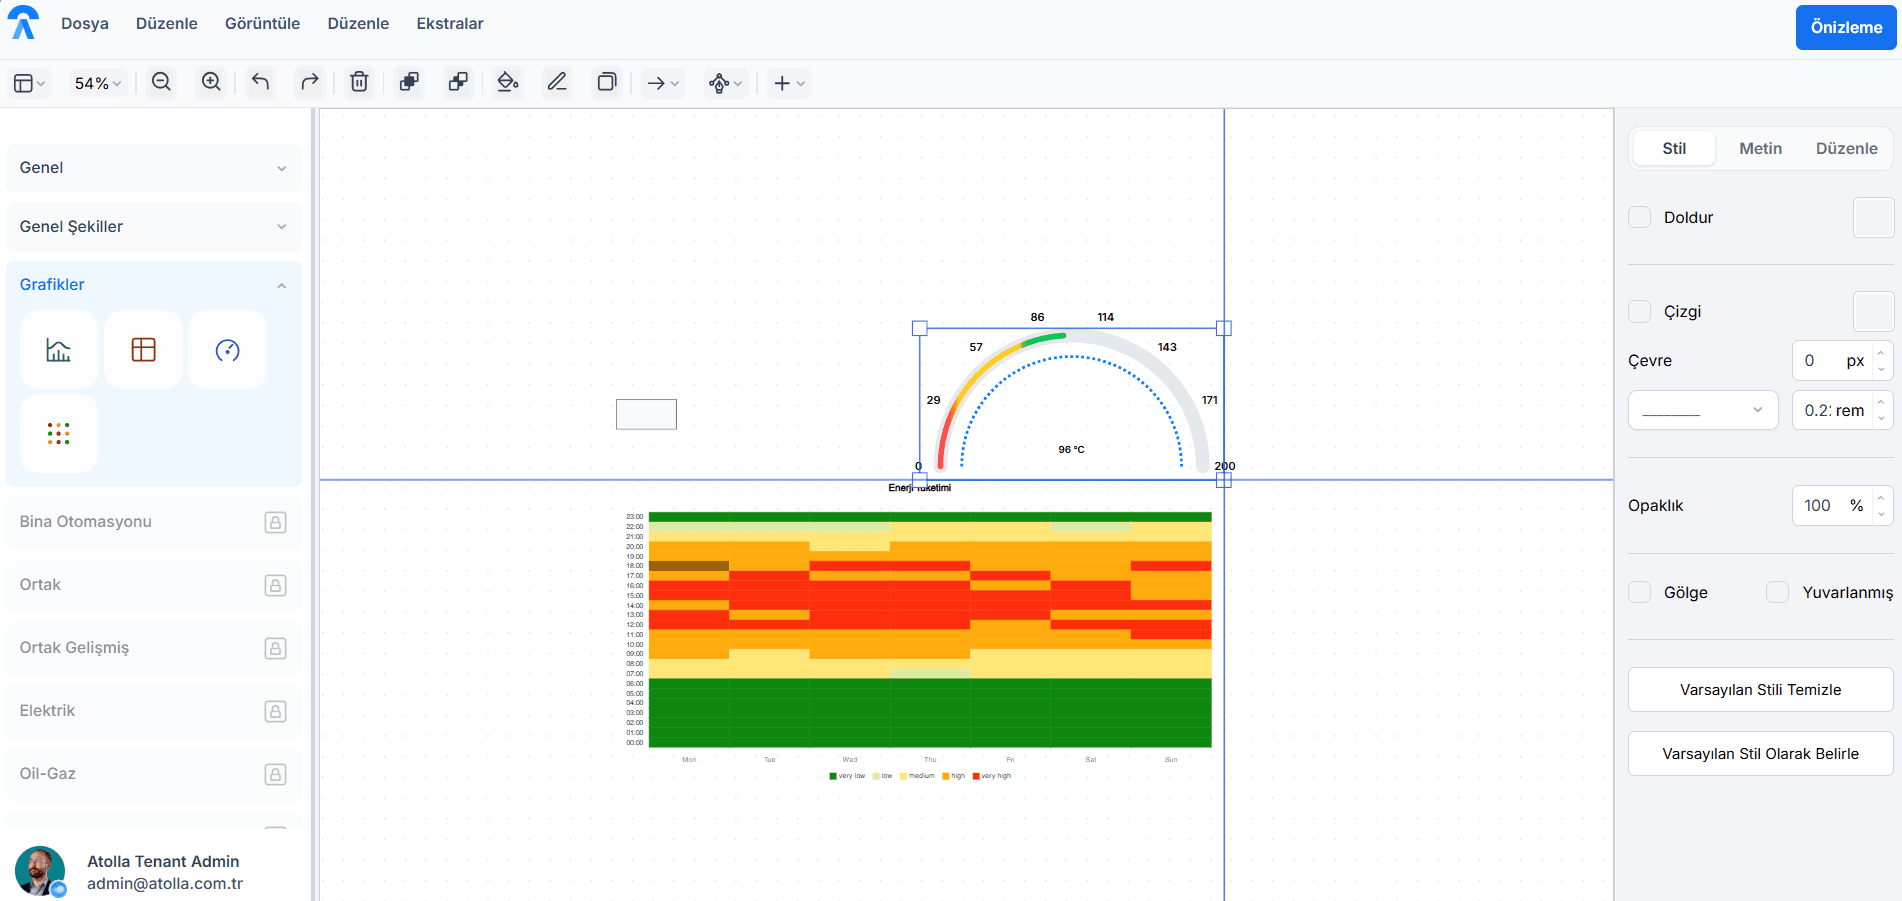
The Mimic Diagram Editor is a React Flow–based canvas application for building interactive process mimics of solar and wind energy installations. Instead of static single-line diagrams, operators and engineers can construct fully configurable displays — with custom node types for panels, inverters, turbines, and meters — bound to live, polling data feeds. The editor supports grouping, layers, undo/redo, copy/paste, and popup diagrams for drilling into sub-systems, giving both the person building the diagram and the person monitoring it a fast, reliable canvas built for real-time operational use.
Key Screens
// section.key.screens
Project Problem
// section.problem
Static and hardcoded monitoring displays for solar and wind assets
Stakeholder Needs
// section.stakeholder.needs
Configurable, No-Rebuild Diagrams
The ability to add, move, and rewire nodes on a diagram without needing a developer to ship a code change for every layout update.
Live, Data-Bound Visualization
Diagram elements that reflect real-time values from live API endpoints — panel output, turbine RPM, inverter status — not stale snapshots.
Support for Complex, Multi-Layer Layouts
A canvas that can represent grouped sub-systems and multiple layers of a site without becoming cluttered or unreadable.
Drill-Down Into Sub-Systems
Popup or nested diagrams so a single top-level view can expand into the detail of a specific inverter block, string, or turbine cluster.
Fast, Reliable Editing Workflow
Undo/redo, copy/paste, and grouping that behave predictably, so building or adjusting a diagram is fast rather than error-prone.
Multiple Visualization Types
Different ways to represent the same underlying data — schematic nodes, charts, and status indicators — depending on what's being monitored.
Consistent Visual Language Across Sites
A shared set of node types and styling so diagrams built for different solar or wind sites stay visually consistent and easy to read.
Customer Needs
// section.customer.needs
Design Process
// section.design.process
RESEARCH
Competitor analysis and user interviews
Information Architecture
Restructuring data hierarchies to reduce time-to-insight
Wireframing
Low-fi sketches, information architecture, user flows
Custom Design System
Using a complete Design System and design tokens
UX/UI Design
Modern interface using a complete Design System and design tokens
Testing
Usability testing with real diagram editors and end users
Handoff
Design System documentation and token-based specifications
The Solution
// section.solution
Custom Node Library & Canvas Editor
[01]A React Flow–based editor with custom node types for panels, inverters, turbines, and meters — built for solar and wind layouts specifically, not generic flowcharts.
Real-Time, Data-Bound Diagrams
[02]Chart nodes and status indicators that poll live API endpoints, so the diagram reflects actual system state instead of a static snapshot.
Layers, Grouping & Popup Diagrams
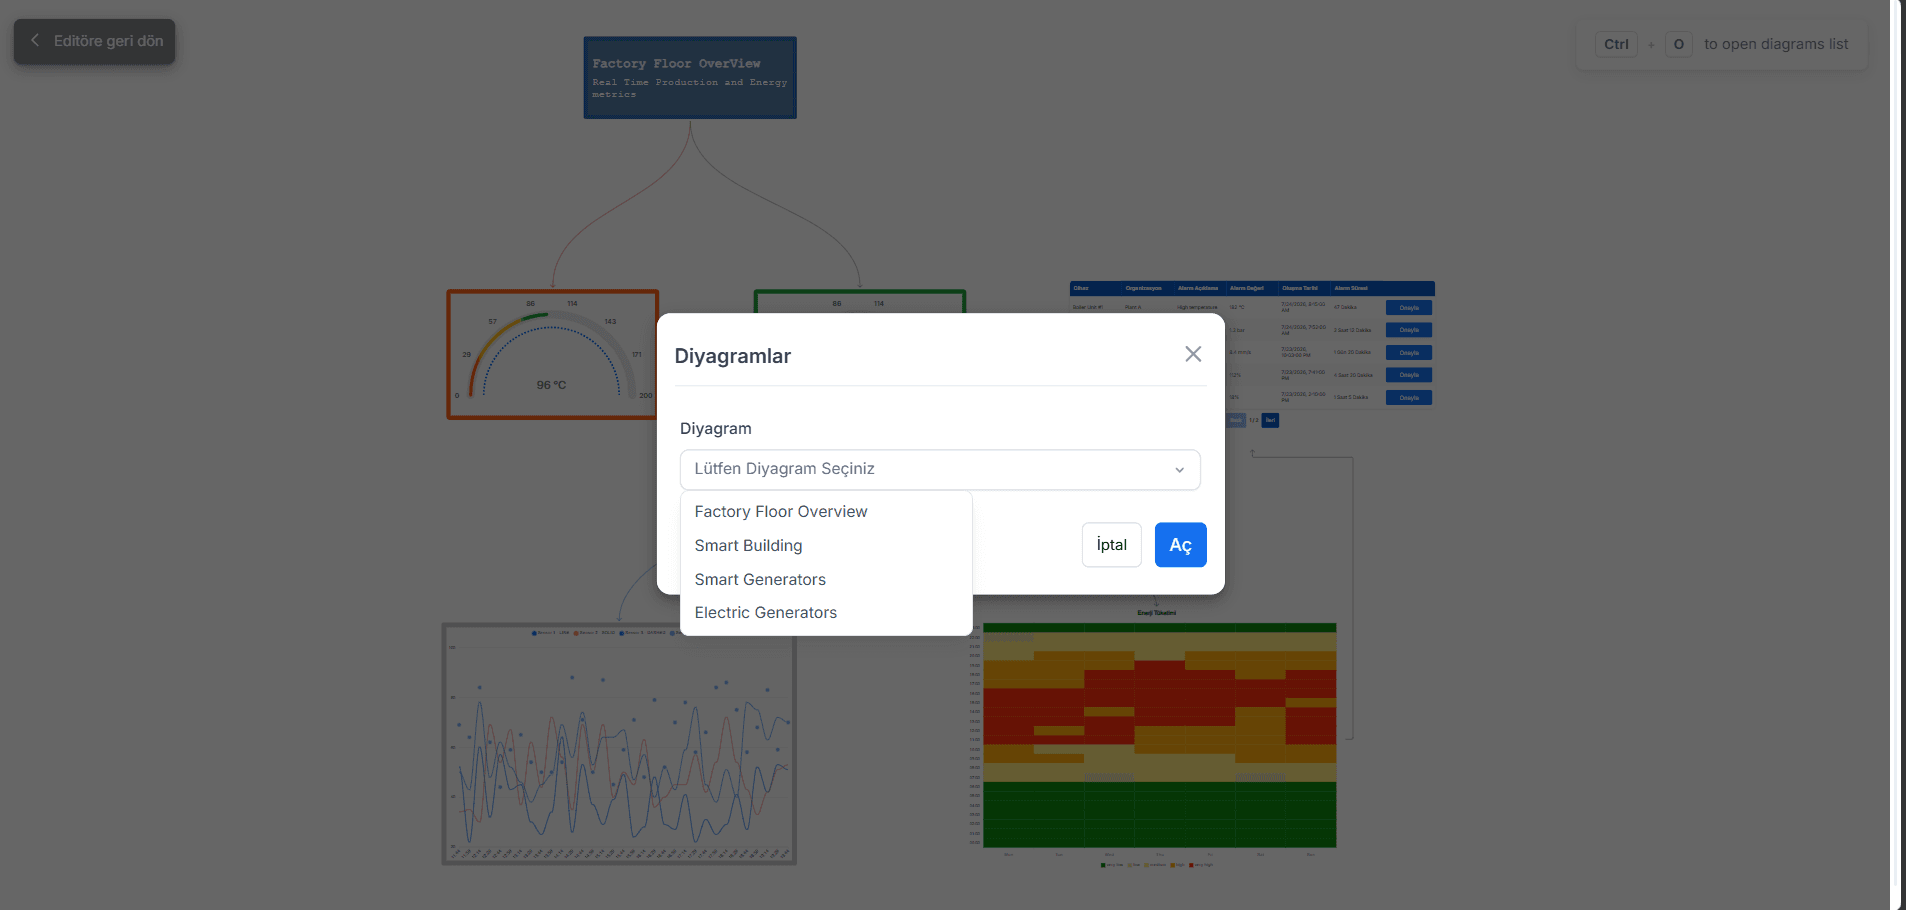
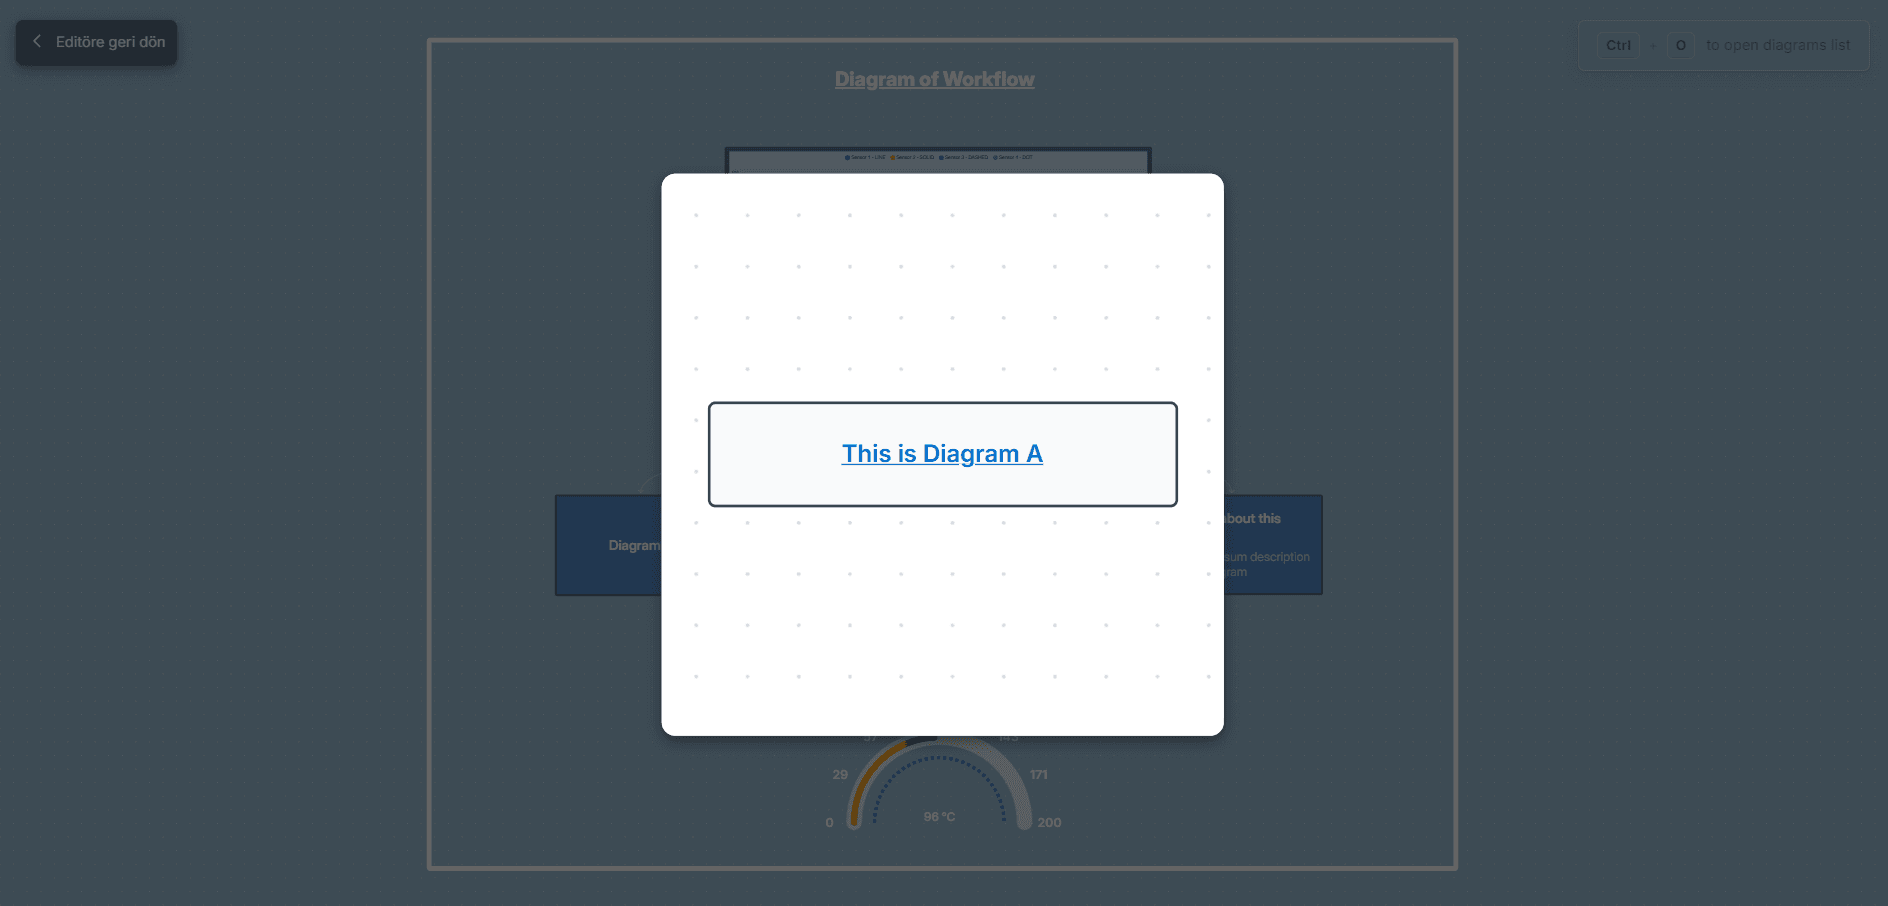
[03]Support for grouping related nodes, organizing layout into layers, and nesting popup diagrams for drilling into a sub-system without leaving the main view.
Fast, Reliable Editing Workflow
[04]Full undo/redo, copy/paste, and helper-line snapping built for speed and correctness, so operators can reconfigure a diagram in minutes, not days.
Learning & Reflections
// section.learning.reflections
Single Source of Truth Is the Foundation of a Stable Canvas
Nearly every hard bug in the editor traced back to two competing sources of state — a global settings bucket and per-node data drifting out of sync. Deriving state from the node itself and writing through one path resolved entire classes of bugs at once.
Refs Over State for Synchronous Guards
Anything timing-sensitive — re-entrancy guards, drag state, dedup checks — needed to mutate synchronously. Async state updates left small windows where duplicate actions or race conditions could slip through.
Store Identity Matters in a Canvas Built on React Flow
React Flow's internal store and the app's own application state are separate systems. Reads and writes have to stay consistent with the same store, or the canvas silently desyncs from what the UI shows.
Real-Time Chart Nodes Need Their Own Discipline
Binding chart nodes to live, polling data introduced its own failure modes — stale field paths, unmemoized chart options, missed series types. Getting live data onto the canvas reliably took as much care as the canvas itself.
Undo/Redo Needs Fresh State, Not Passed-In Snapshots
Rebuilding history to read fresh state internally, rather than trusting values passed in from a render closure, eliminated a whole category of stale-snapshot bugs in undo/redo.
Small Rendering Details Compound at Scale
Details like using outline instead of border for selection indicators, or unifying dash-pattern handling across nodes and edges, mattered far more once diagrams grew large and dense with real site data.
Next Project
Power Quality Management
Front-End Developer

Let's Talk
Ready to build something great together?
I'm currently available for new opportunities and exciting projects.
Feel free to reach out — I usually reply within 24 hours.